Continuing to update on-chain data for @NEARProtocol
First, thanks to @NEARProtocol for the generous serving of pig trotter rice. Now, back to the main topic, CBD data, token cost basis allocation.
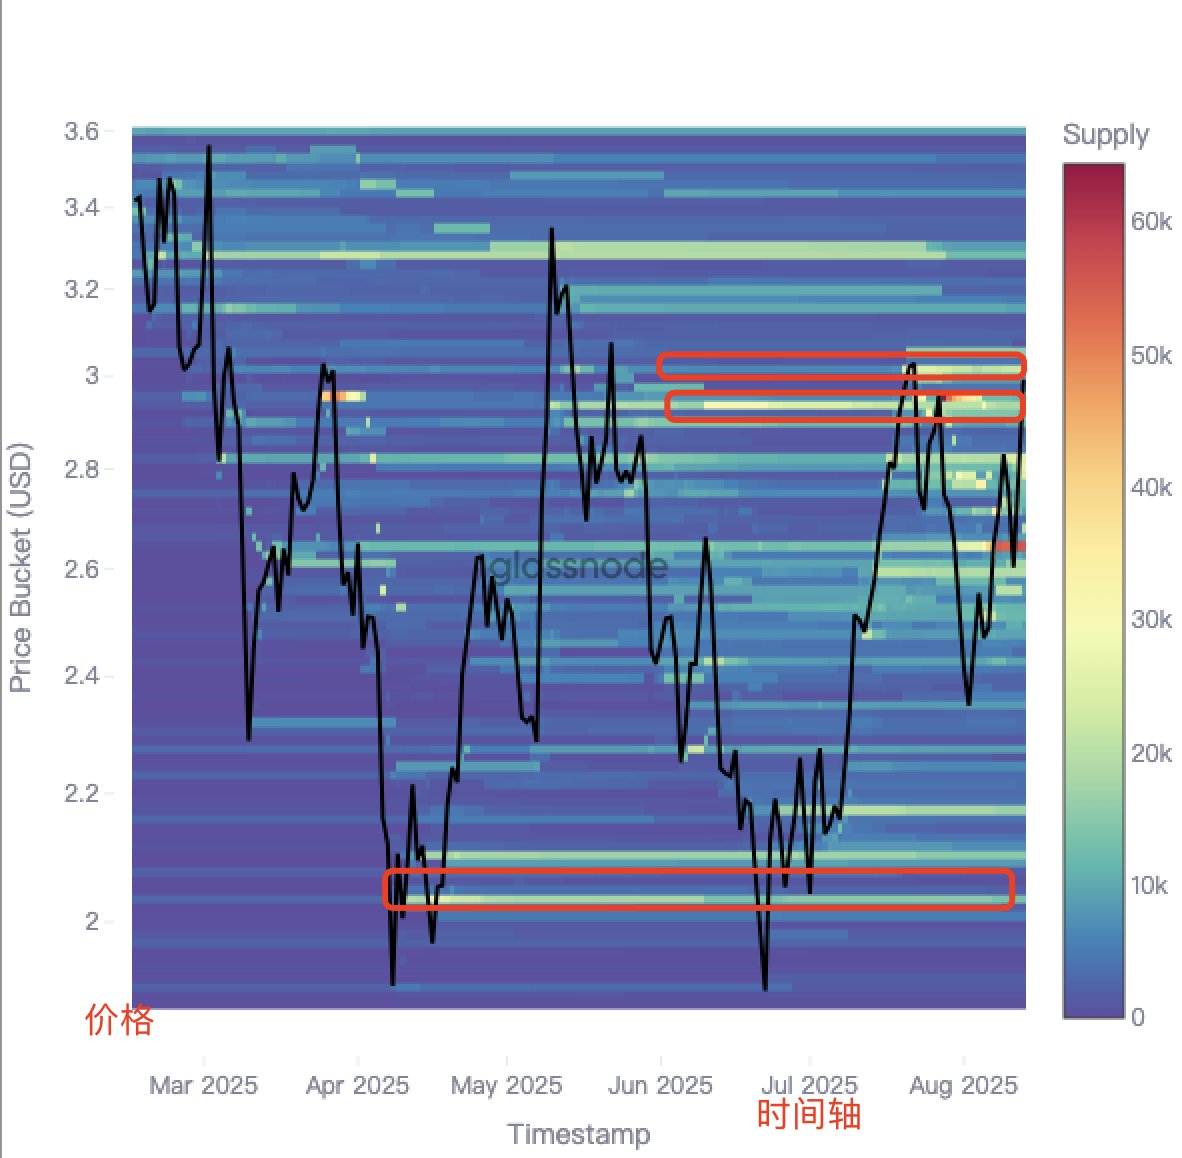
Absolute value (key cost basis level): CBD reflects the total supply held by addresses whose average cost basis falls within a specific price range, as indicated by the z-value (color intensity) in the heatmap.
Dynamic time series: The time series view allows you to understand how the token supply acquired at different price levels is redistributed as future prices change.
As shown in the figure below, currently, due to the impact of the market reaching new highs, NEAR is closely following and has now reached the resistance level at 3, as can also be seen from the candlestick chart.
Next, we still need to observe the changes in market sentiment. The data can be referenced, but it's not investment advice. Thank you, everyone.


Update on @NEARProtocol on-chain data still requires attention to the overall market trend.
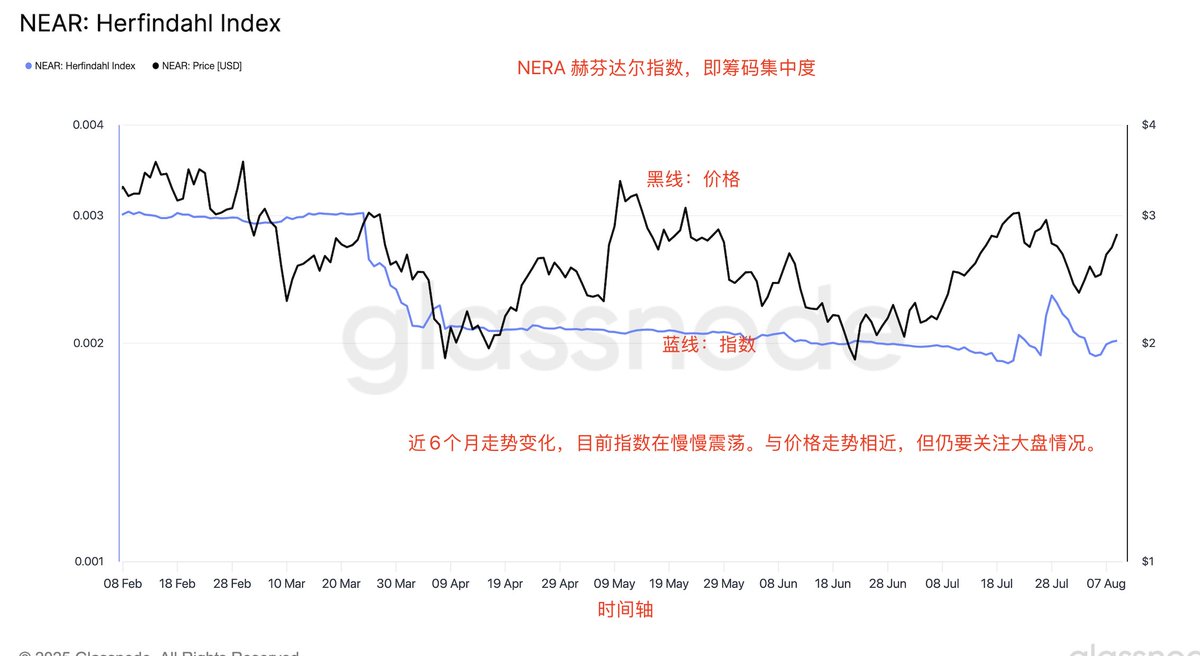
The Herfindahl Index, which measures the concentration of chips, is used to assess the share of network addresses in the current supply, indicating the level of concentration. A high index indicates that a few large holders are dominating the market, while a low index suggests a more even distribution of chips.
As shown in the figure. @NEARProtocol
Cost Basis Distribution (CBD) data
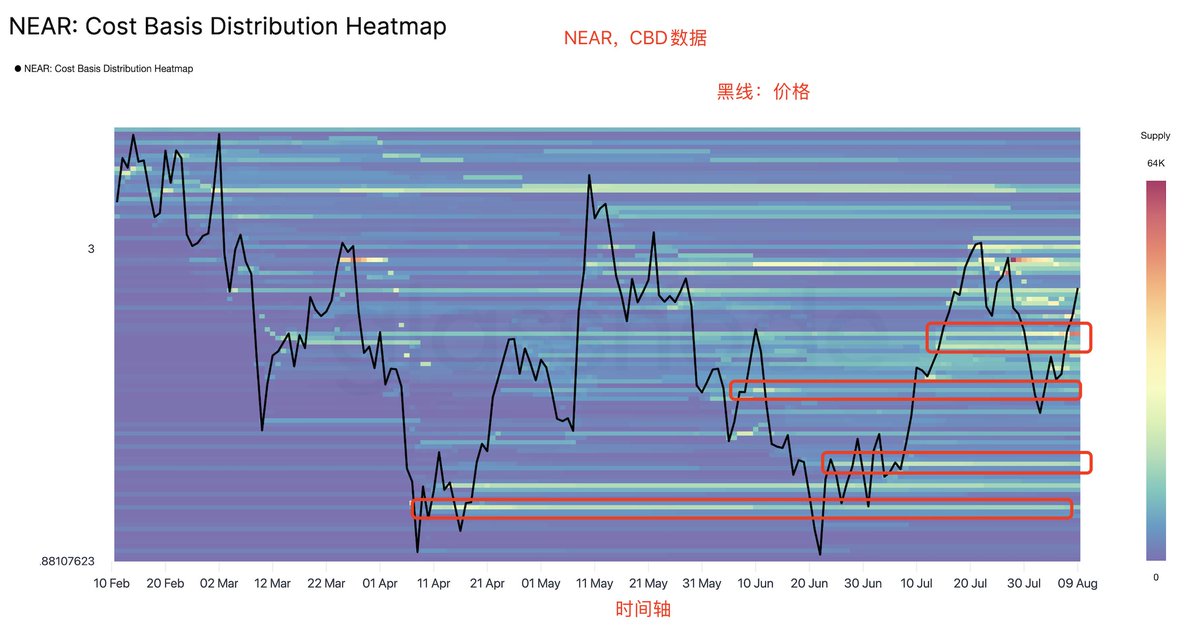
The Cost Basis Distribution (CBD) heatmap provides a detailed visualization of supply density at price levels over a specific time period (e.g., 1 month, 1 year). By selecting a time range, this indicator displays a heatmap where the y-axis represents the cost basis on a logarithmic scale, ranging from below 1% of the lowest price in the selected time period to above 1% of the highest price.
The color intensity of each pixel reflects the concentration of supply at that price level, allowing investors to identify key acquisition points corresponding to significant portions of asset supply.
This helps to better understand the relationship between price levels and cumulative supply density, thereby gaining insights into potential support and resistance areas based on historical acquisition levels.
As shown in the figure. For reference and learning, not investment advice.


7.43K
42
The content on this page is provided by third parties. Unless otherwise stated, OKX is not the author of the cited article(s) and does not claim any copyright in the materials. The content is provided for informational purposes only and does not represent the views of OKX. It is not intended to be an endorsement of any kind and should not be considered investment advice or a solicitation to buy or sell digital assets. To the extent generative AI is utilized to provide summaries or other information, such AI generated content may be inaccurate or inconsistent. Please read the linked article for more details and information. OKX is not responsible for content hosted on third party sites. Digital asset holdings, including stablecoins and NFTs, involve a high degree of risk and can fluctuate greatly. You should carefully consider whether trading or holding digital assets is suitable for you in light of your financial condition.

